Troubleshoot universe issues
Metrics Page
In the Admin Console, select the Universe page, then go to the Metrics tab. The page shows a number of interactive metrics graphs that capture the state of the Yugabyte Universe over time.
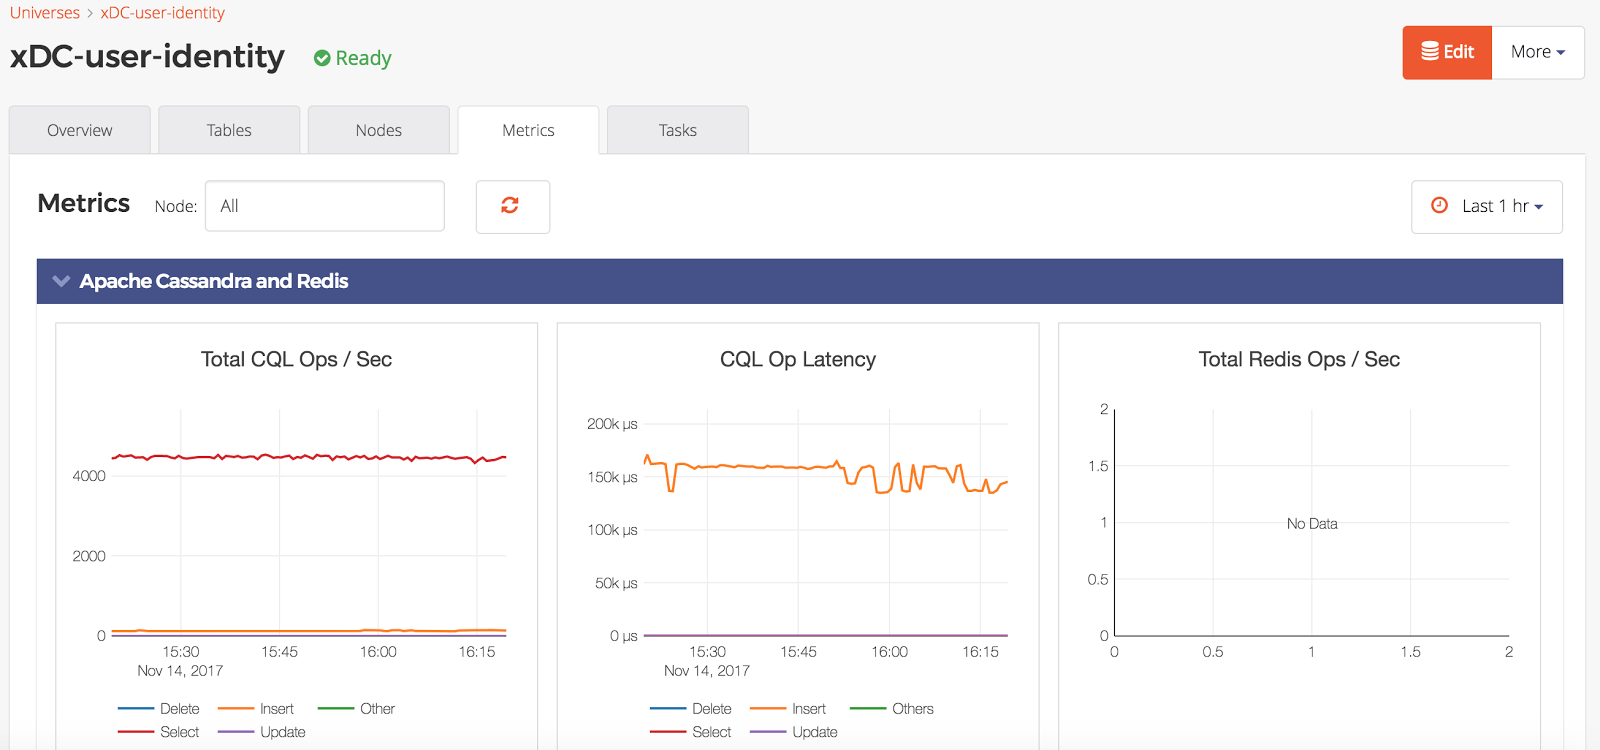
Note: For a quick overview, check the query ops and latency graphs as well as the CPU, memory, disk, and network usage graphs. In case of dips or spikes the other graphs will offer additional information that can help diagnose the issue.
Nodes Status
In the Admin Console, click on the Universe page, then go to the Nodes tab. The page will show the status of the Master and TServer on each YugabyteDB node.
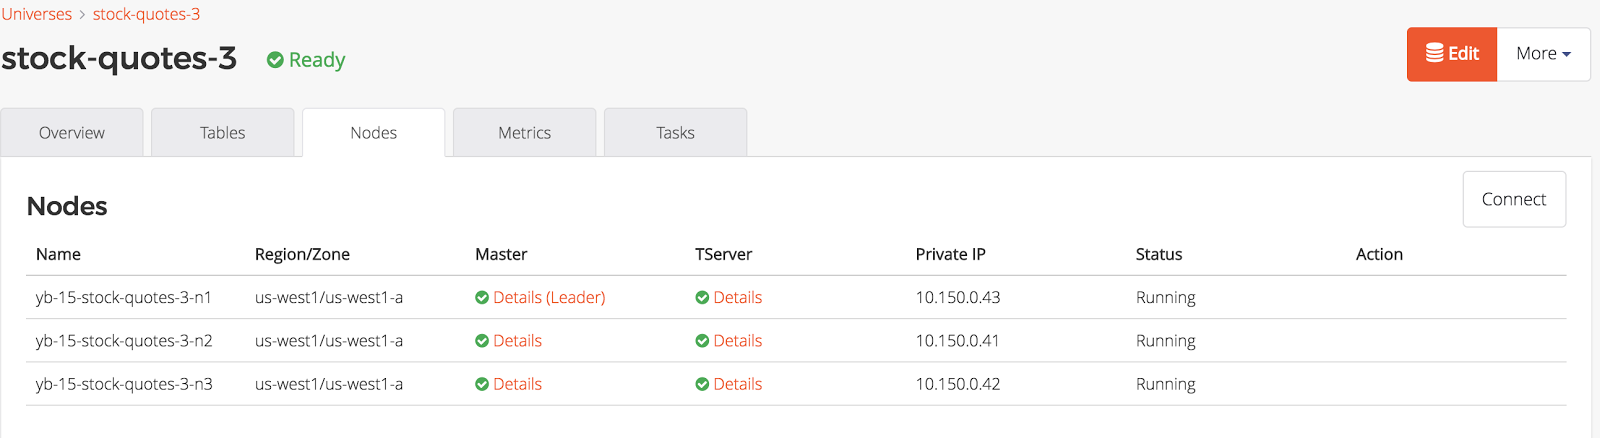
In case of issues, more information about each Master or TServer is available on its respective Details page.
Generally the link is: <node-ip>:7000 for Masters and <node-ip>:9000 for TServers.
Note that in some setups, these links may not be accessible, depending on the configuration of your on-premises data center or cloud-provider account. To fix this, read more here.
Check Host Resources on the Nodes
To check host resources on your YugabyteDB nodes, run the following script, replacing the IP addresses with the IP addresses of your YugabyteDB nodes.
for IP in 10.1.13.150 10.1.13.151 10.1.13.152; \
do echo $IP; \
  ssh $IP \
    'echo -n "CPUs: ";cat /proc/cpuinfo | grep processor | wc -l; \
      echo -n "Mem: ";free -h | grep Mem | tr -s " " | cut -d" " -f 2; \
      echo -n "Disk: "; df -h / | grep -v Filesystem'; \
done
The output display will look similar to this:
10.1.12.103
CPUs: 72
Mem: 251G
Disk: /dev/sda2       160G   13G  148G   8% /
10.1.12.104
CPUs: 88
Mem: 251G
Disk: /dev/sda2       208G   22G  187G  11% /
10.1.12.105
CPUs: 88
Mem: 251G
Disk: /dev/sda2       208G  5.1G  203G   3% /